Despite its current salience among politicians and negotiators, a recent poll revealed that British people place the so-called “divorce bill” well down in their list of priorities below immigration control, co-operation, free trade, and the customs union. People in France and Germany, on the other hand, consider it a priority to make sure the UK pays what it owes. And Michel Barnier, of course, also considers the settlement to be a sticking point and has expressed concern that the talks are at a deadlock, stating that progress needs to be made on this matter before they can move on to other aspects of the negotiations.
However, our new Brexit data suggest that in the minds of British people, the divorce bill is not so clearly antecedent, and separate from other aspects of the negotiations.
We conducted an online survey, asking our 5,000 respondents how much they would be willing to pay on the so-called divorce bill. We fully acknowledge that this is a difficult question: there is very little information in the public domain about what the settlement might cover, and the kind of amounts in question are pretty difficult for even the most interested of us to get our heads round (and “infuriatingly arbitrary” as the Guardian put it recently).
So, we provided the respondents with a sliding scale that included an equivalent household amount to give a rough guide of what the amount might mean in terms of a personal cost. (E.g. a divorce bill of £5billion would be around £180 per household and £70 billion would be equivalent to around £2,500, for example).
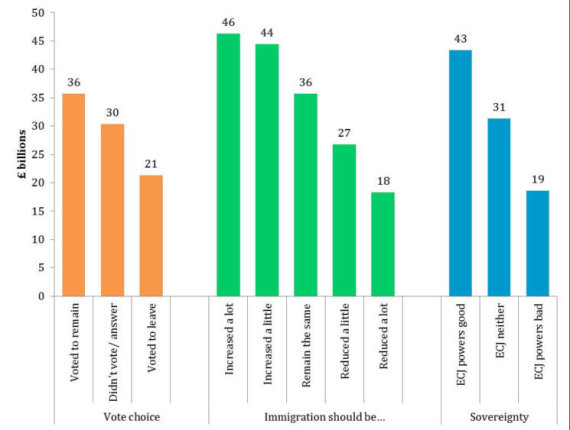
The most frequently given answer, by 17% of the sample, was zero and a further 13% suggested the lowest non-zero option of £5 billion. The overall average considered to be a reasonable amount for the divorce bill was £29 billion, and just 15% went above the mid-point of the scale to suggest a figure of above £50 billion. (Our results are broadly in line with previous polls on the topic). In Figure 1, we show how this average of £29billion varies by other opinions.
Fig 1 The amount people think is reasonable for the “divorce bill” strongly reflects other Brexit-related preferences

Data collected online by Kantar Public between July 10 and August 2 2017. N = 5300. ECJ = European Court of Justice. Refer to briefing note for question wordings.
People who voted to leave the EU suggest a lower amount on average (£21billion) than people who voted to remain (£36billion). Similarly, we find that people who are in favour of increasing immigration a lot are willing to pay a far larger amount (£46billion) than those preferring that immigration should be reduced a lot (£18billion), and that people who approve of the jurisdiction of the European Court of Justice more willing to pay (£43billion) than those who oppose these powers (£19billion).
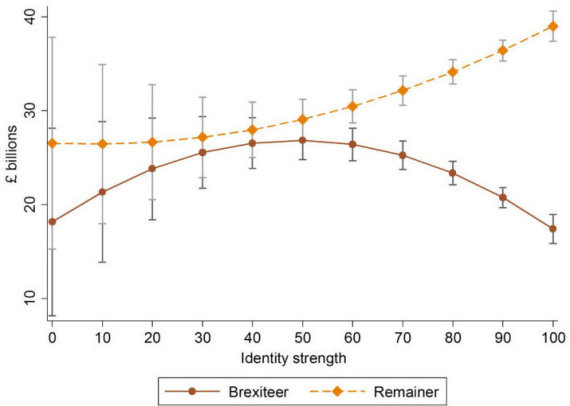
We also asked our survey respondents whether they think of themselves as a Brexiteer or a Remainer, a question about identity (how they feel) rather than behaviour (how they voted). To those who identified as one or the other (42% Brexiteer and 45% Remainer, 87% total) we went on to ask about the strength of that identity on a scale of 0-100.
We find, as shown in Figure 2, that as self-identified Brexiteers increase in identity strength, the less they are willing to pay. We find the opposite pattern for self-identified Remainers who suggest higher amounts the stronger their identity. This may be a factor that polarizes the public debate on the issue, as prominent politicians on both sides, such as Boris Johnson (who has said that the EU can “go whistle”) and Vince Cable (who thinks we should consider our moral obligations), will be among the stronger identifiers.
Fig 2 Those feeling more strongly about being a Remainer are willing to pay more on the divorce bill, and vice versa for the Brexiteers

Notes: Average marginal effects based on an interaction of identity and identity strength; age and education are controlled. The bars show 95% confidence intervals. The bars are wide at low identity strength because relatively few respondents have such weak identities.
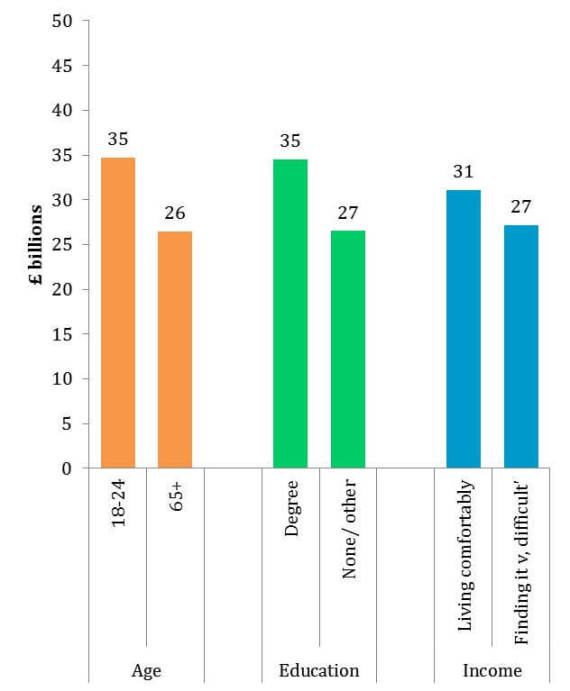
We wanted to check the robustness of our findings. After all, we know that people with higher incomes were more likely to vote to remain in the EU, and people with higher incomes are more likely to dismiss the personal household equivalent amounts as a drop in the ocean. That did not seem to be the case, however. If you look at Fig 3, you can see it’s true that people struggling on their household incomes gave lower amounts on average, but it is a rather minor difference compared to those we showed in Fig 1. And, what’s more, when we control for household income (and education and age) the huge differences we showed in Figs 1 and 2 do not diminish by much.

In the absence of information about the components of the bill, therefore, it appears that identities and other attitudes matter the most, rather than demographics. Perhaps it is not so surprising to learn that divorce-bill attitudes are closely linked with other attitudes, but it shows us that some aspects of public opinion are intertwined and inter-related. It is the individuals who desire a closer relationship with Europe who are willing to pay more for the divorce bill. On the other hand, those with a preference for distance – in terms of escaping the jurisdiction of the ECJ and stopping free movement – are less willing to pay.
Dr Lindsay Richards is co-investigator at The UK in a Changing EuropeThis blog first appeared on The UK in a Changing Europe site, and can be read here